The charts below plot the number of new daily cases and total cases of COVID-19 since the start of the Cape Cod epidemic. All data come from the Massachusetts Department of Public Health at https://www.mass.gov/info-details/covid-19-response-reporting.
The first chart plots the total number of cases and the 7-day moving average of the daily case counts. Smoothing the graph by averaging the data helps to identify trends, because substantial day-to-day variability obscures trends in plots of individual daily counts.
Cape Cod embarked on Phase 1 of the Baker-Polito plan for “reopening the economy” on May 18, Phase 2 on June 8 and June 22, and Phase 3 on July 6, which are highlighted on the charts by vertical yellow bars.
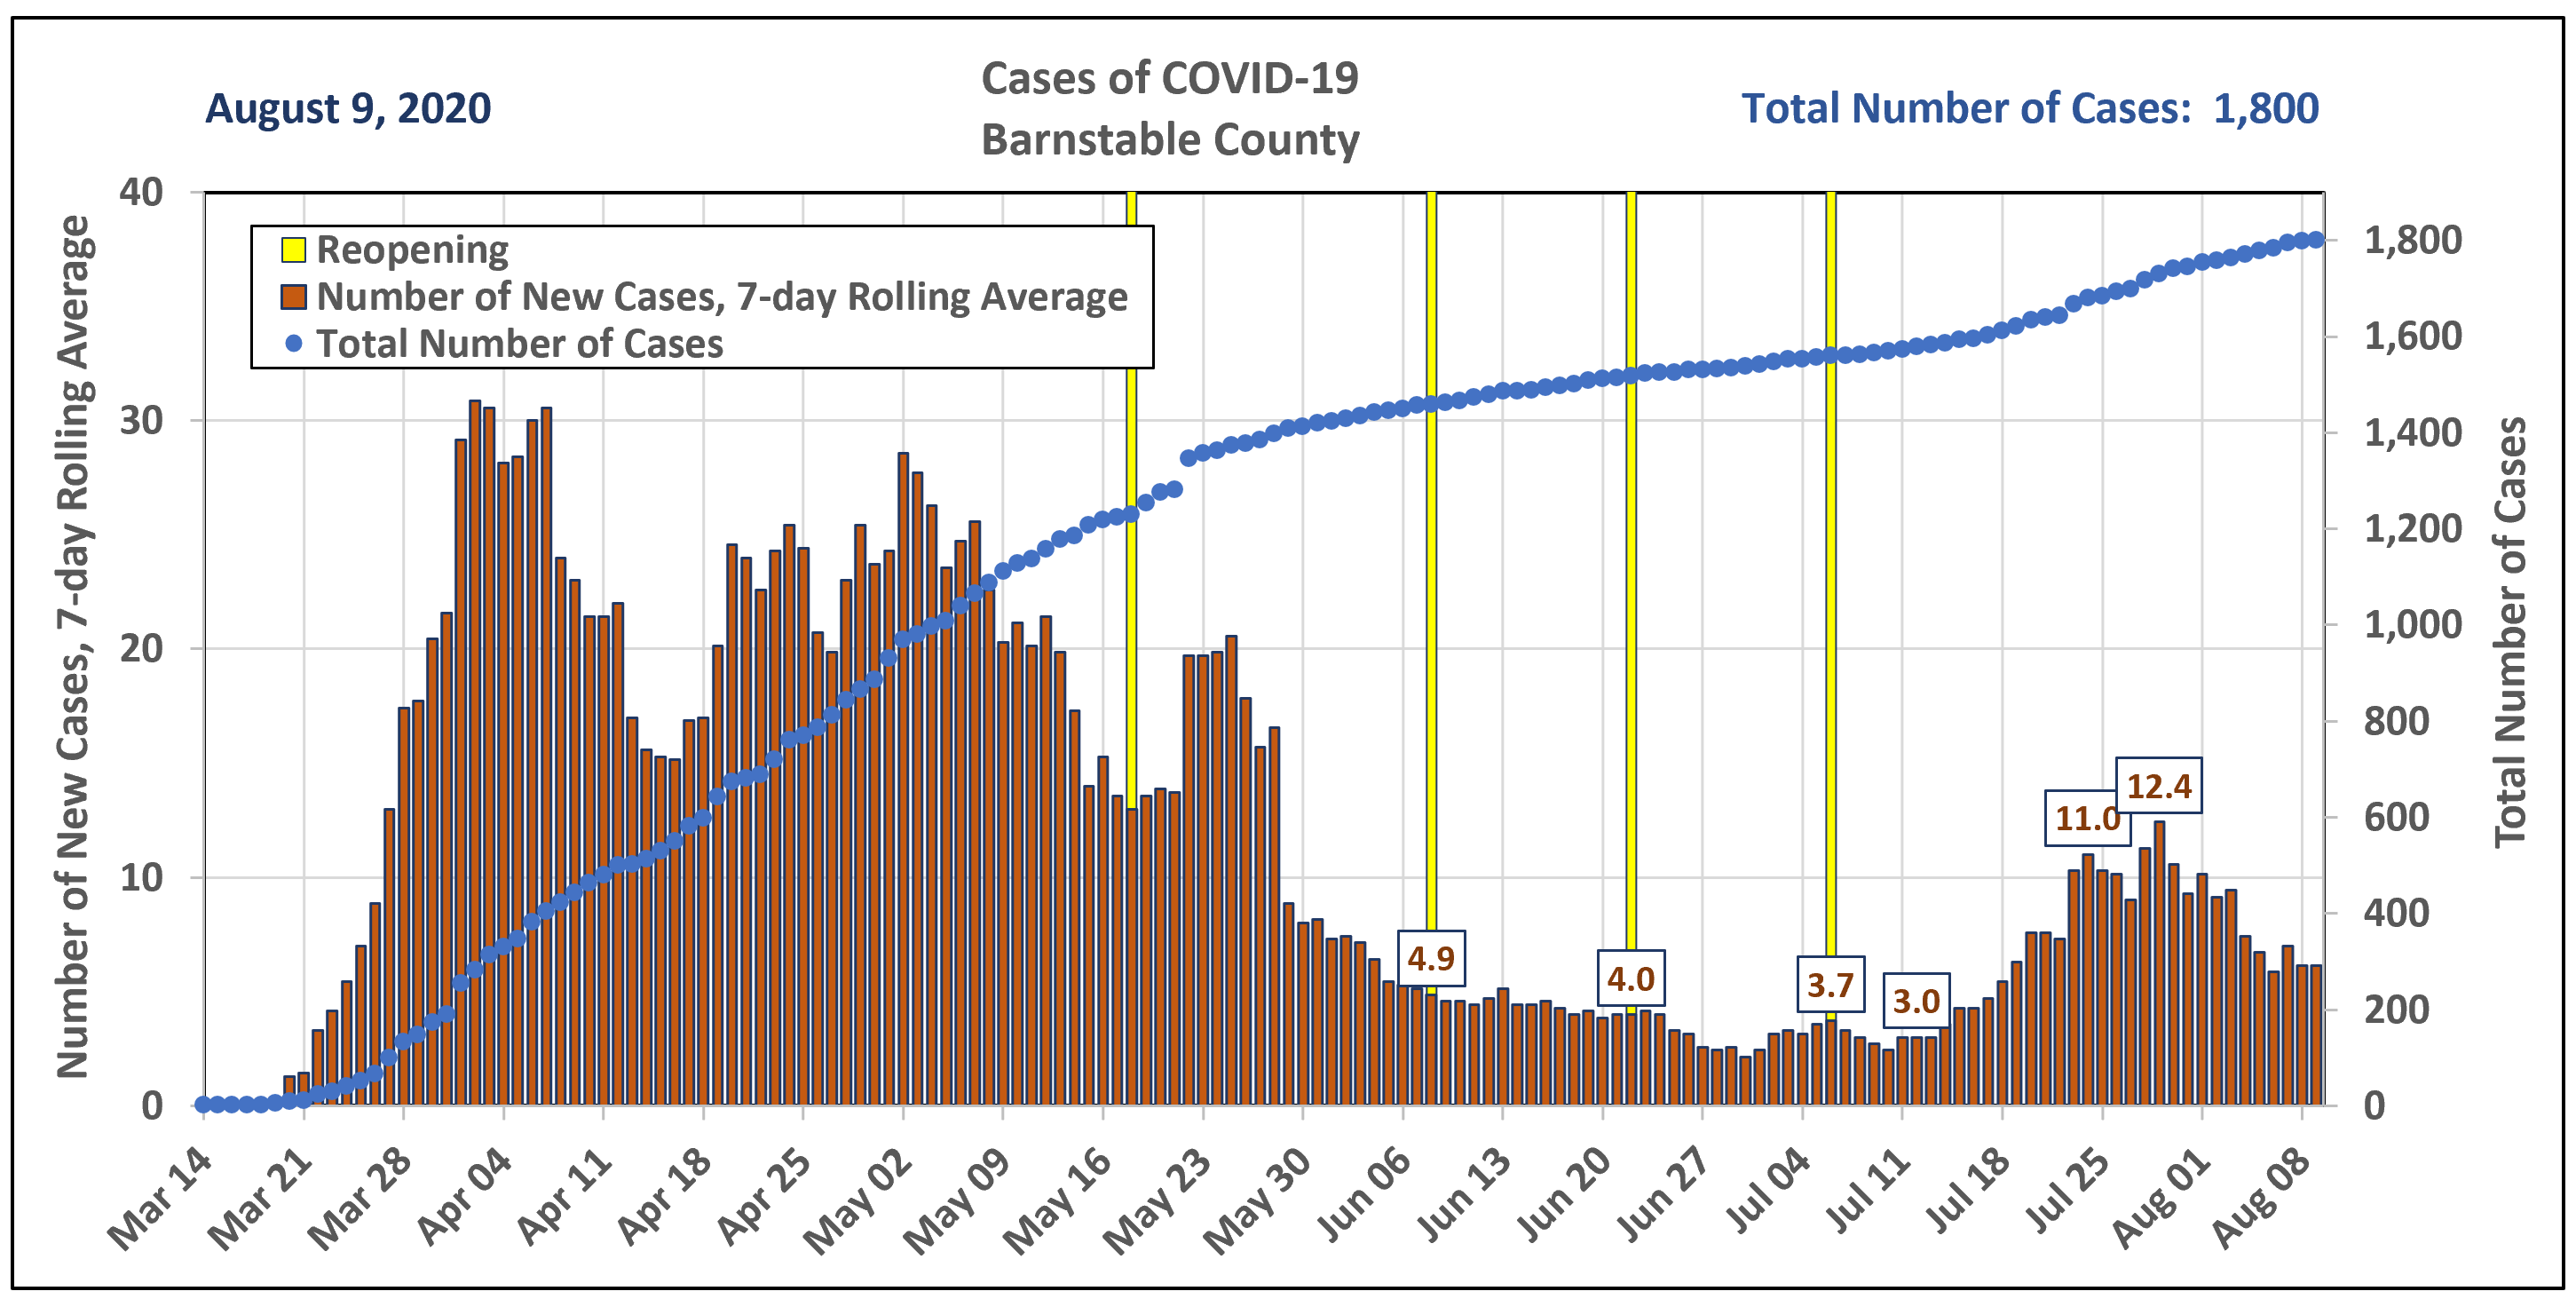
Technical note: The bump in the 7-day rolling average number new cases daily from May 22 through May 28 is probably a measuring artifact caused by 64 new cases reported on May 22. This out-of-the-ordinary number was almost certainly the result of a statewide push to test for COVID-19 in long-term care facilities. (On May 18 the Baker administration encouraged the testing of all residents in long-term facilities whether or not they had symptoms.)
Analysis: The number of new COVID-19 cases per day has shown a number of peaks and valleys since the first case in Barnstable County was reported on March 14. Then it suddenly surged from 3.0 to 11.0 new cases per day between July 12 and July 24. Most of these new cases were probably generated by a July 12 Chatham house party reported by the Cape Cod Times on July 22. The subsequent bump to 12.4 cases is probably associated with another cluster of cases produced by a party attended by Falmouth lifeguards on July 18 and reported by the Times on July 27. The number of new cases of COVID-19 reported since the date of the first party exceeds the number known to have originated at the parties, which indicates that other sources have contributed to the surge.
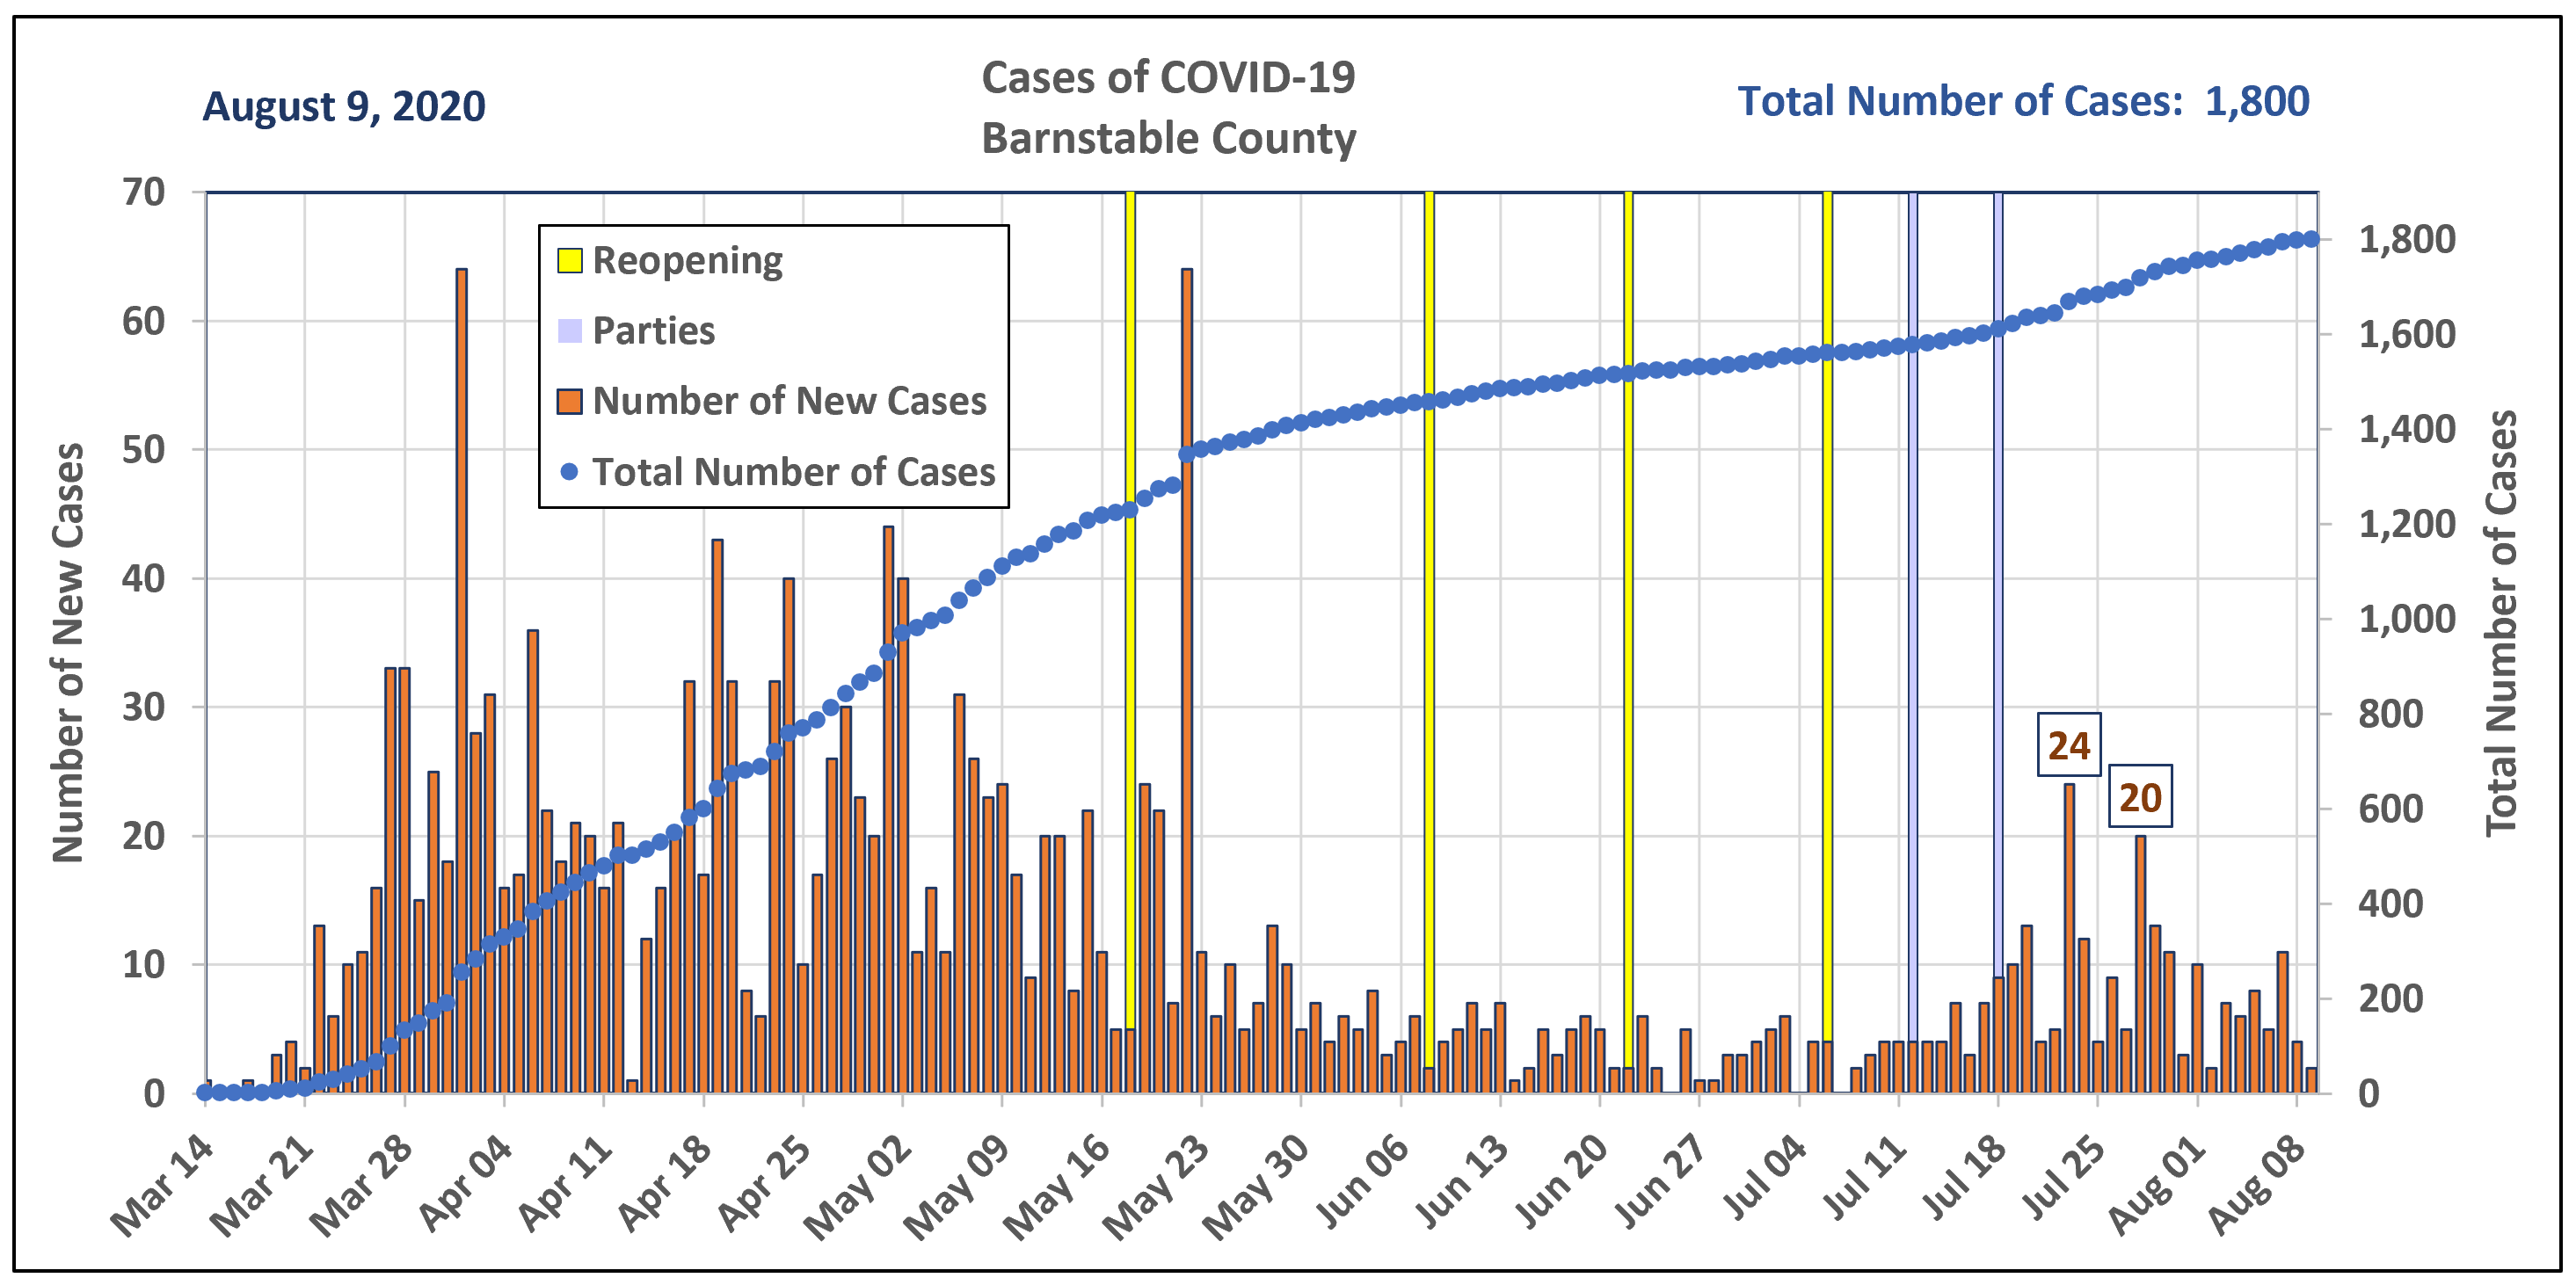
Below is the same plot as the one above, except that the highly variable individual numbers of new cases reported daily are shown rather than the 7-day rolling averages. The dates of the parties mentioned above are designated by vertical blue bars.
See charts and analysis of COVID-19 deaths in Barnstable County at: DEATHS.