Early in the Cape Cod COVID-19 epidemic I developed this website to publish charts that are detailed enough to show day-to-day changes in data reflecting spread of the disease in Barnstable County. A particularly impressive surge appeared in July.
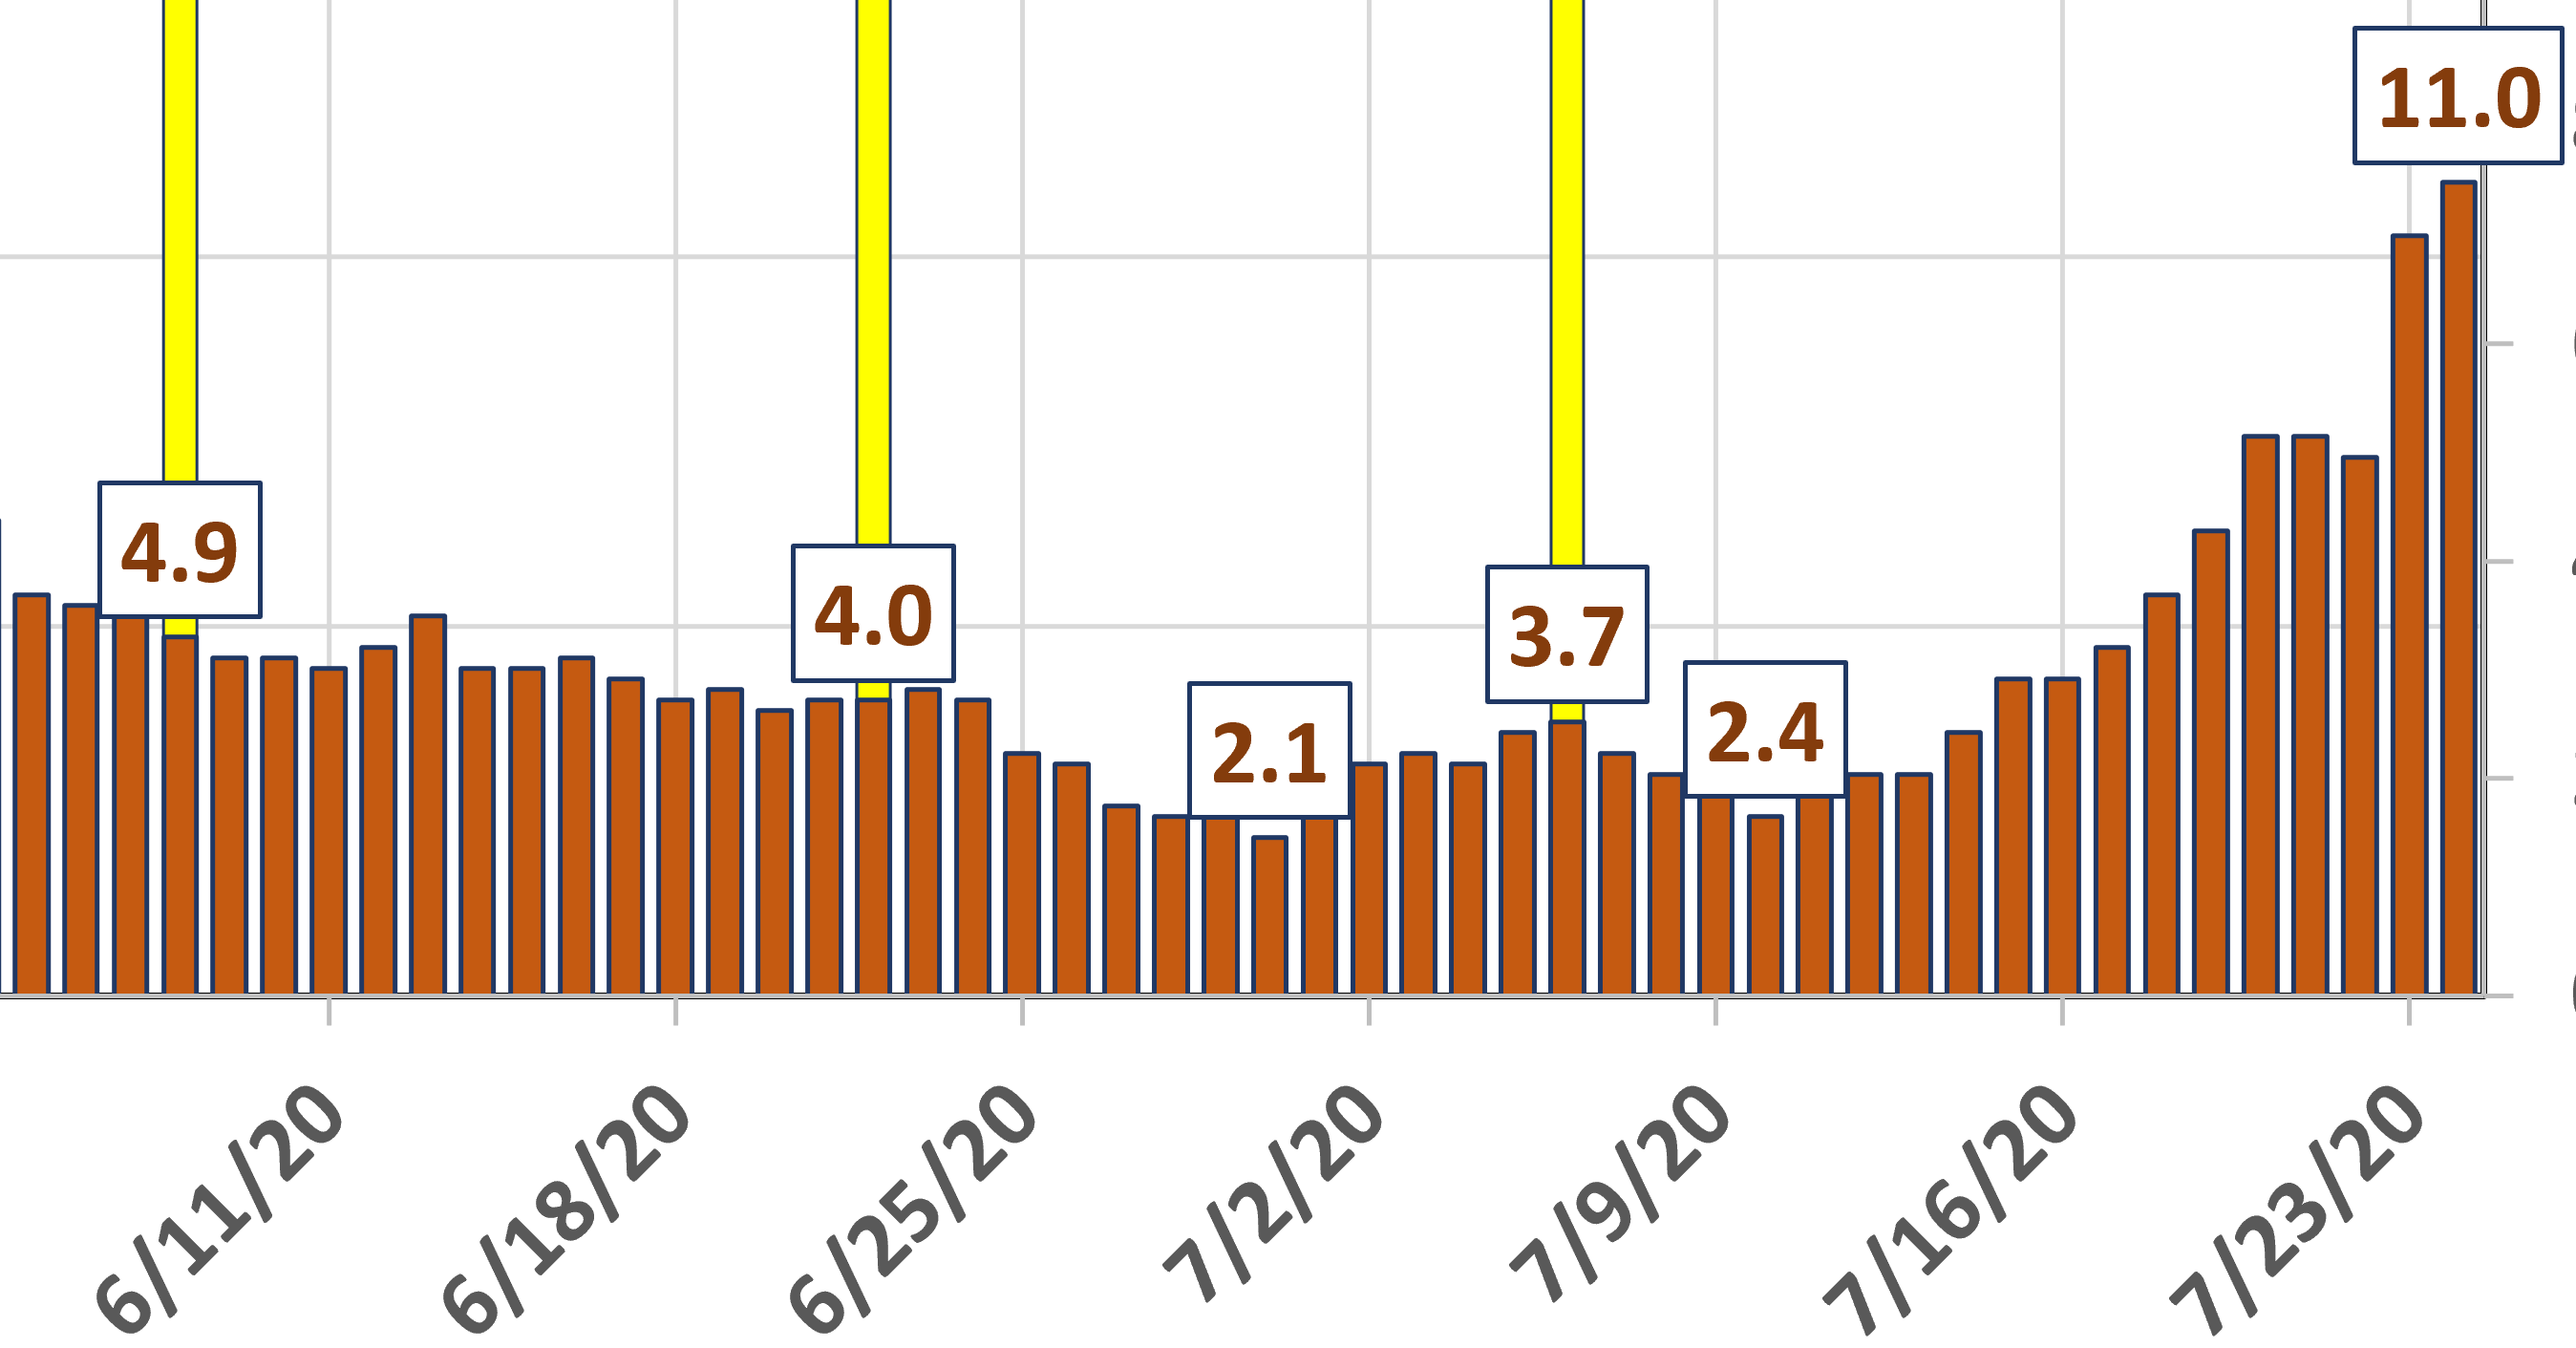
During the 2 weeks between July 10 and July 24, the 7-day rolling average number of new COVID-19 cases in Barnstable County increased from 2.4 to 11.0 new cases per day.
Here is a mini-chart that graphically shows this trend. The red bars measure the counts of new daily cases from June 5 through July 24, while the text boxes give the counts on specific dates. The yellow bars designate starting dates for reopening phases.
The source of this surge was probably a July 12 Chatham house party. Subsequently, another party attended by Falmouth lifeguards produced a second rise. These trends can be seen in the charts at CASES
Similar surges can also be seen in the case-count charts of nearly all other Massachusetts counties at OTHER COUNTIES.