The data displayed in the Massachusetts and the Barnstable County charts at MASSACHUSETTS and CASES all come from the Massachusetts Department of Public Health at https://www.mass.gov/info-details/covid-19-response-reporting.
Both sets of charts show data the Mass. DPH updates daily in raw data files – County.csv for the Barnstable County charts – CasesByDate.csv, DateofDeath.csv, and TestingByDate for the Massachusetts charts.
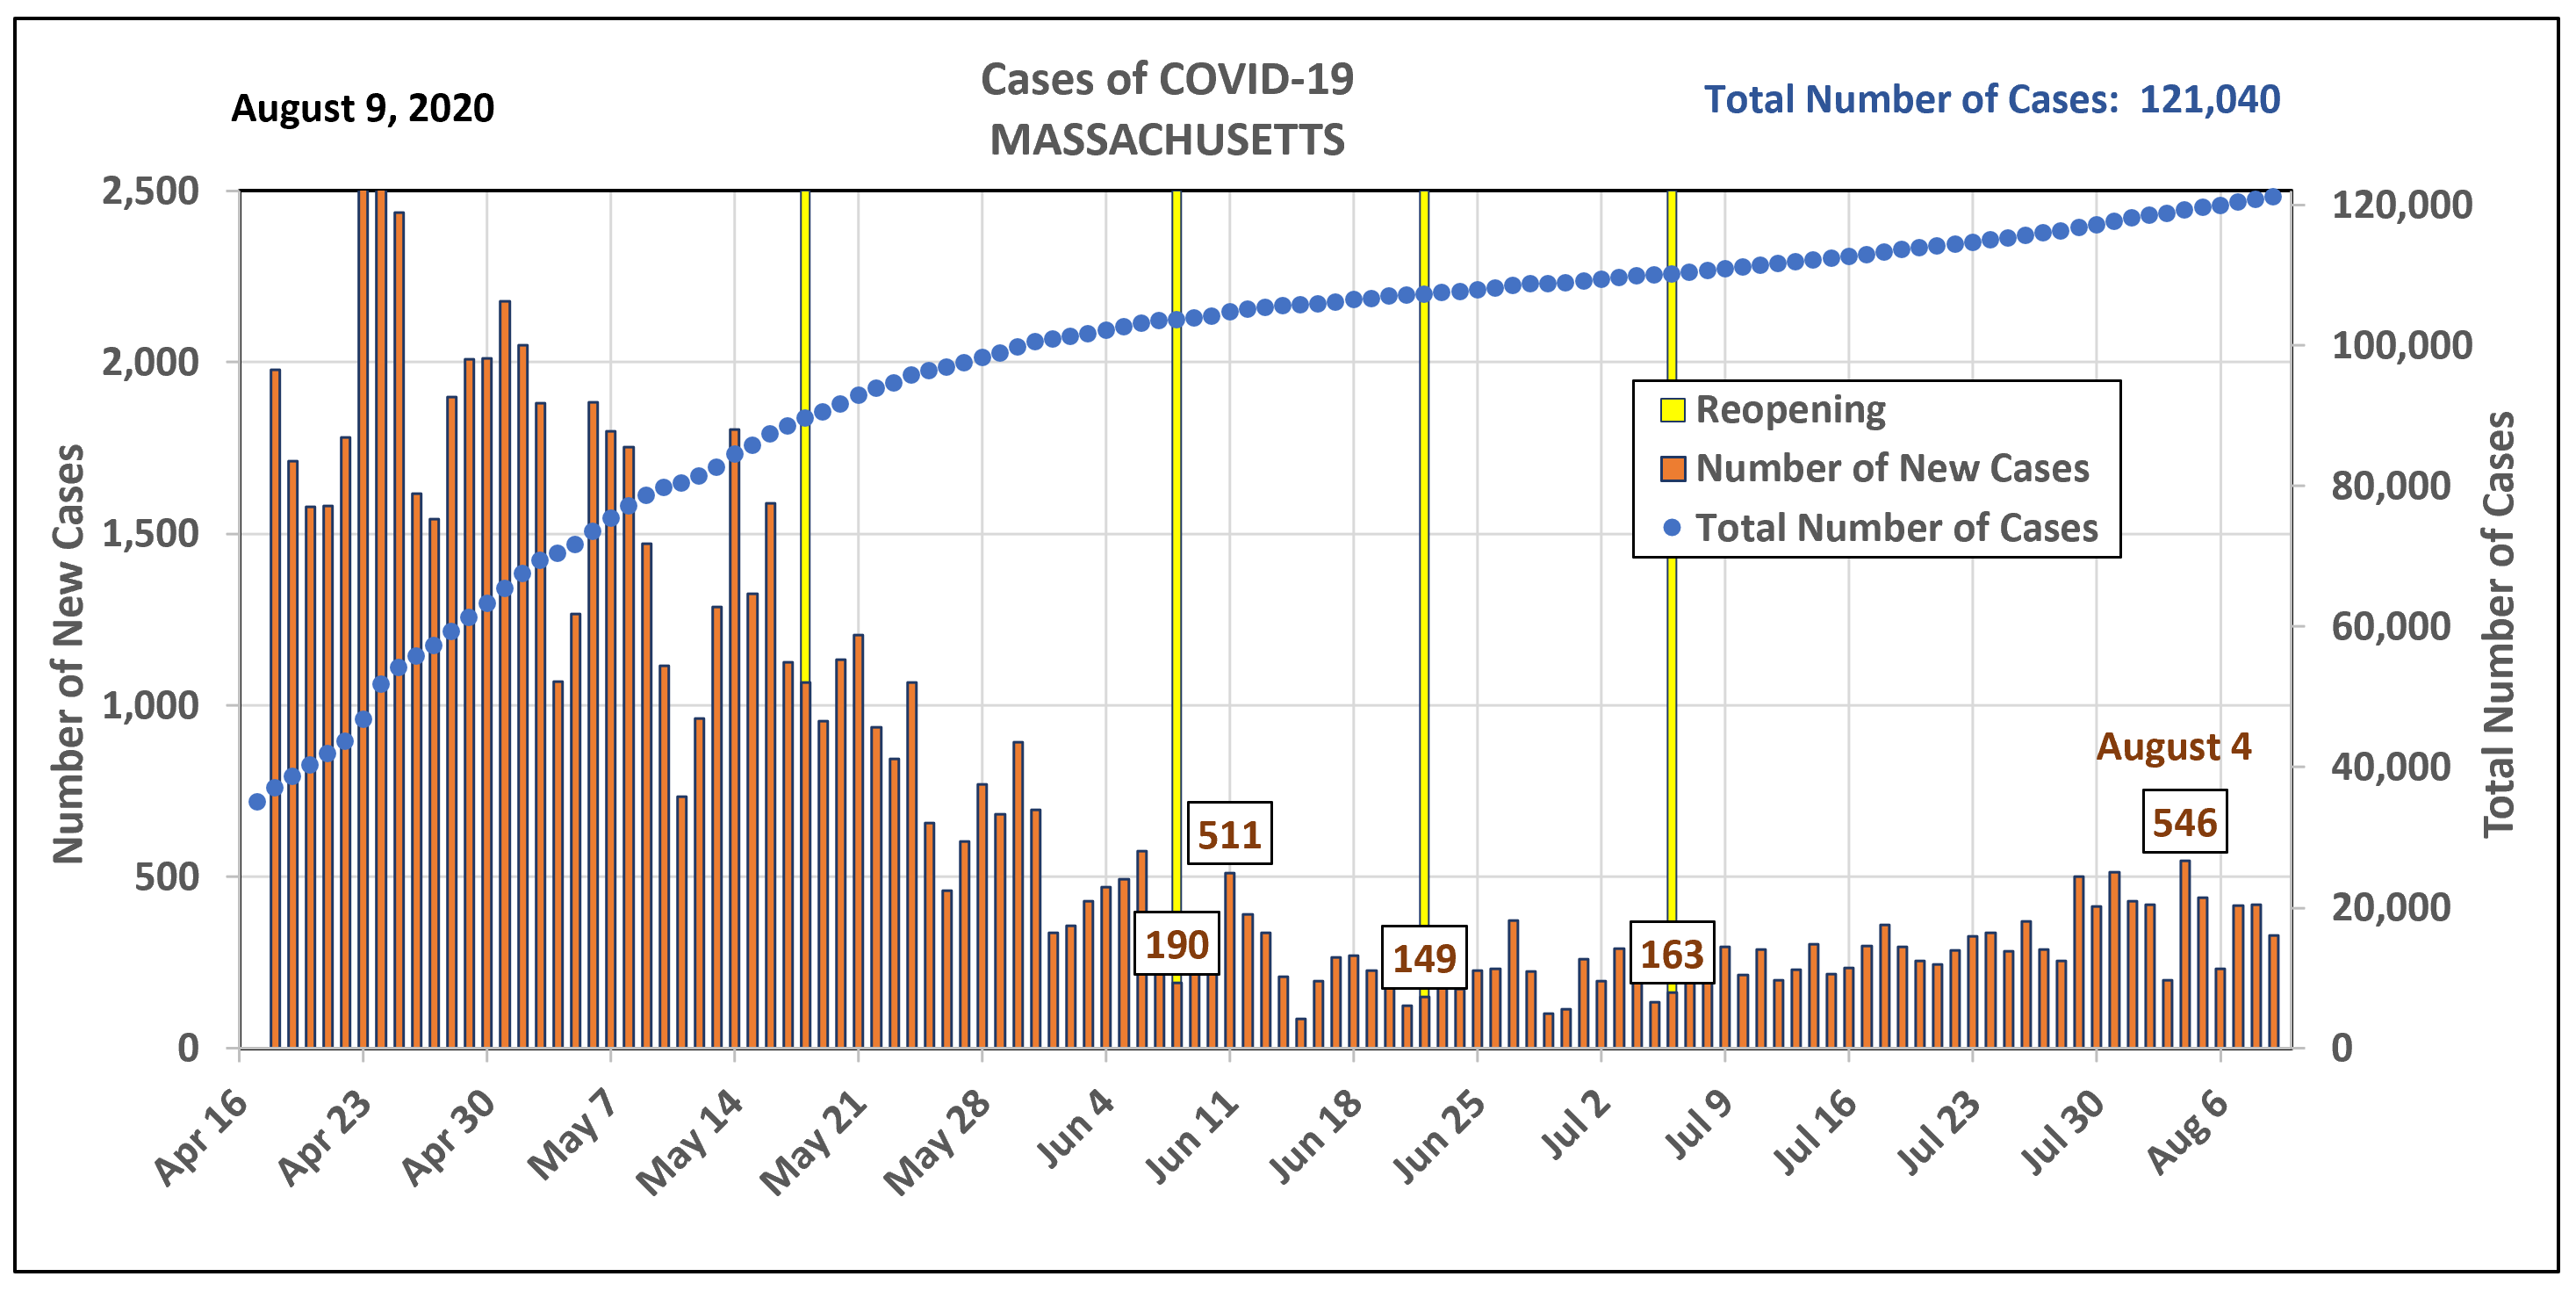
Because County.csv contains daily case counts for every county in Massachusetts, I was able to add the county-specific numbers (14 of them, one for each county) to come up with daily case counts for the commonwealth as a whole. Theoretically, the chart of those data should look the same as the Massachusetts case-count chart derived from CasesByDate.csv. However, they look quite different.
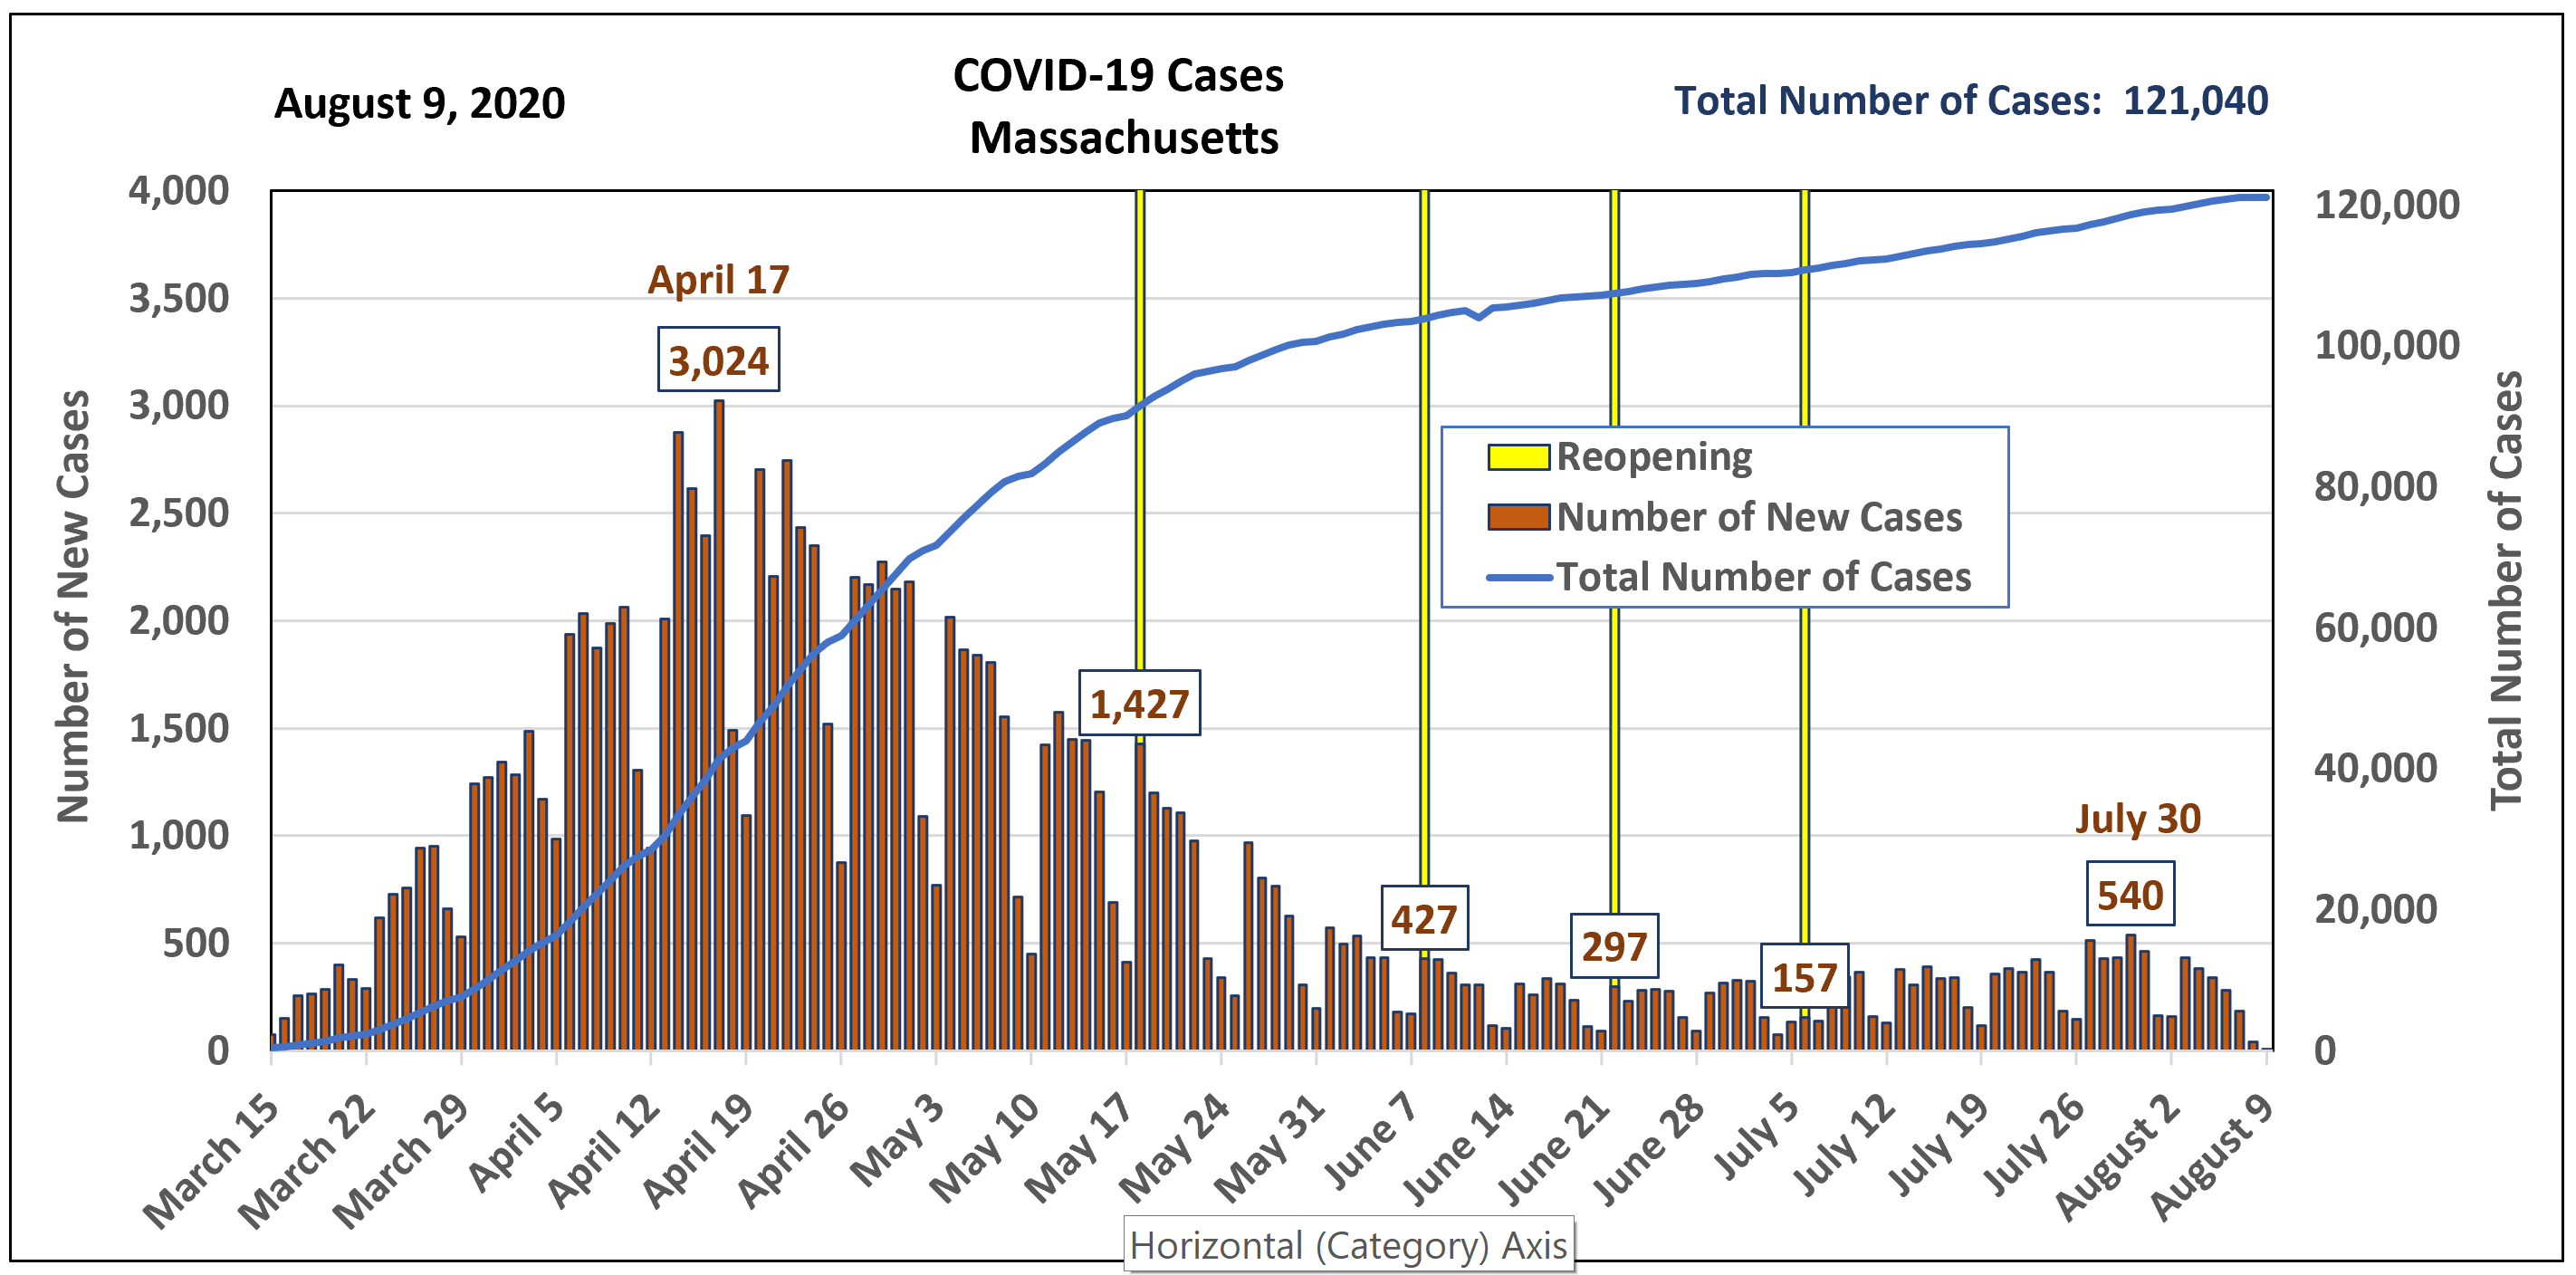
The first chart below displays the Massachusetts daily case counts derived from County.csv, while the second chart displays the Massachusetts daily case counts derived from CasesByDate.csv. I cannot explain the difference. However, they both show an upward trend over the past couple of months. The 546 new cases of COVID-19 reported on August 4 shown in the first chart was the highest daily case count since 511 new cases were reported on June 11. The second chart below shows 538 new cases on July 30, which was the largest daily case count since early June.
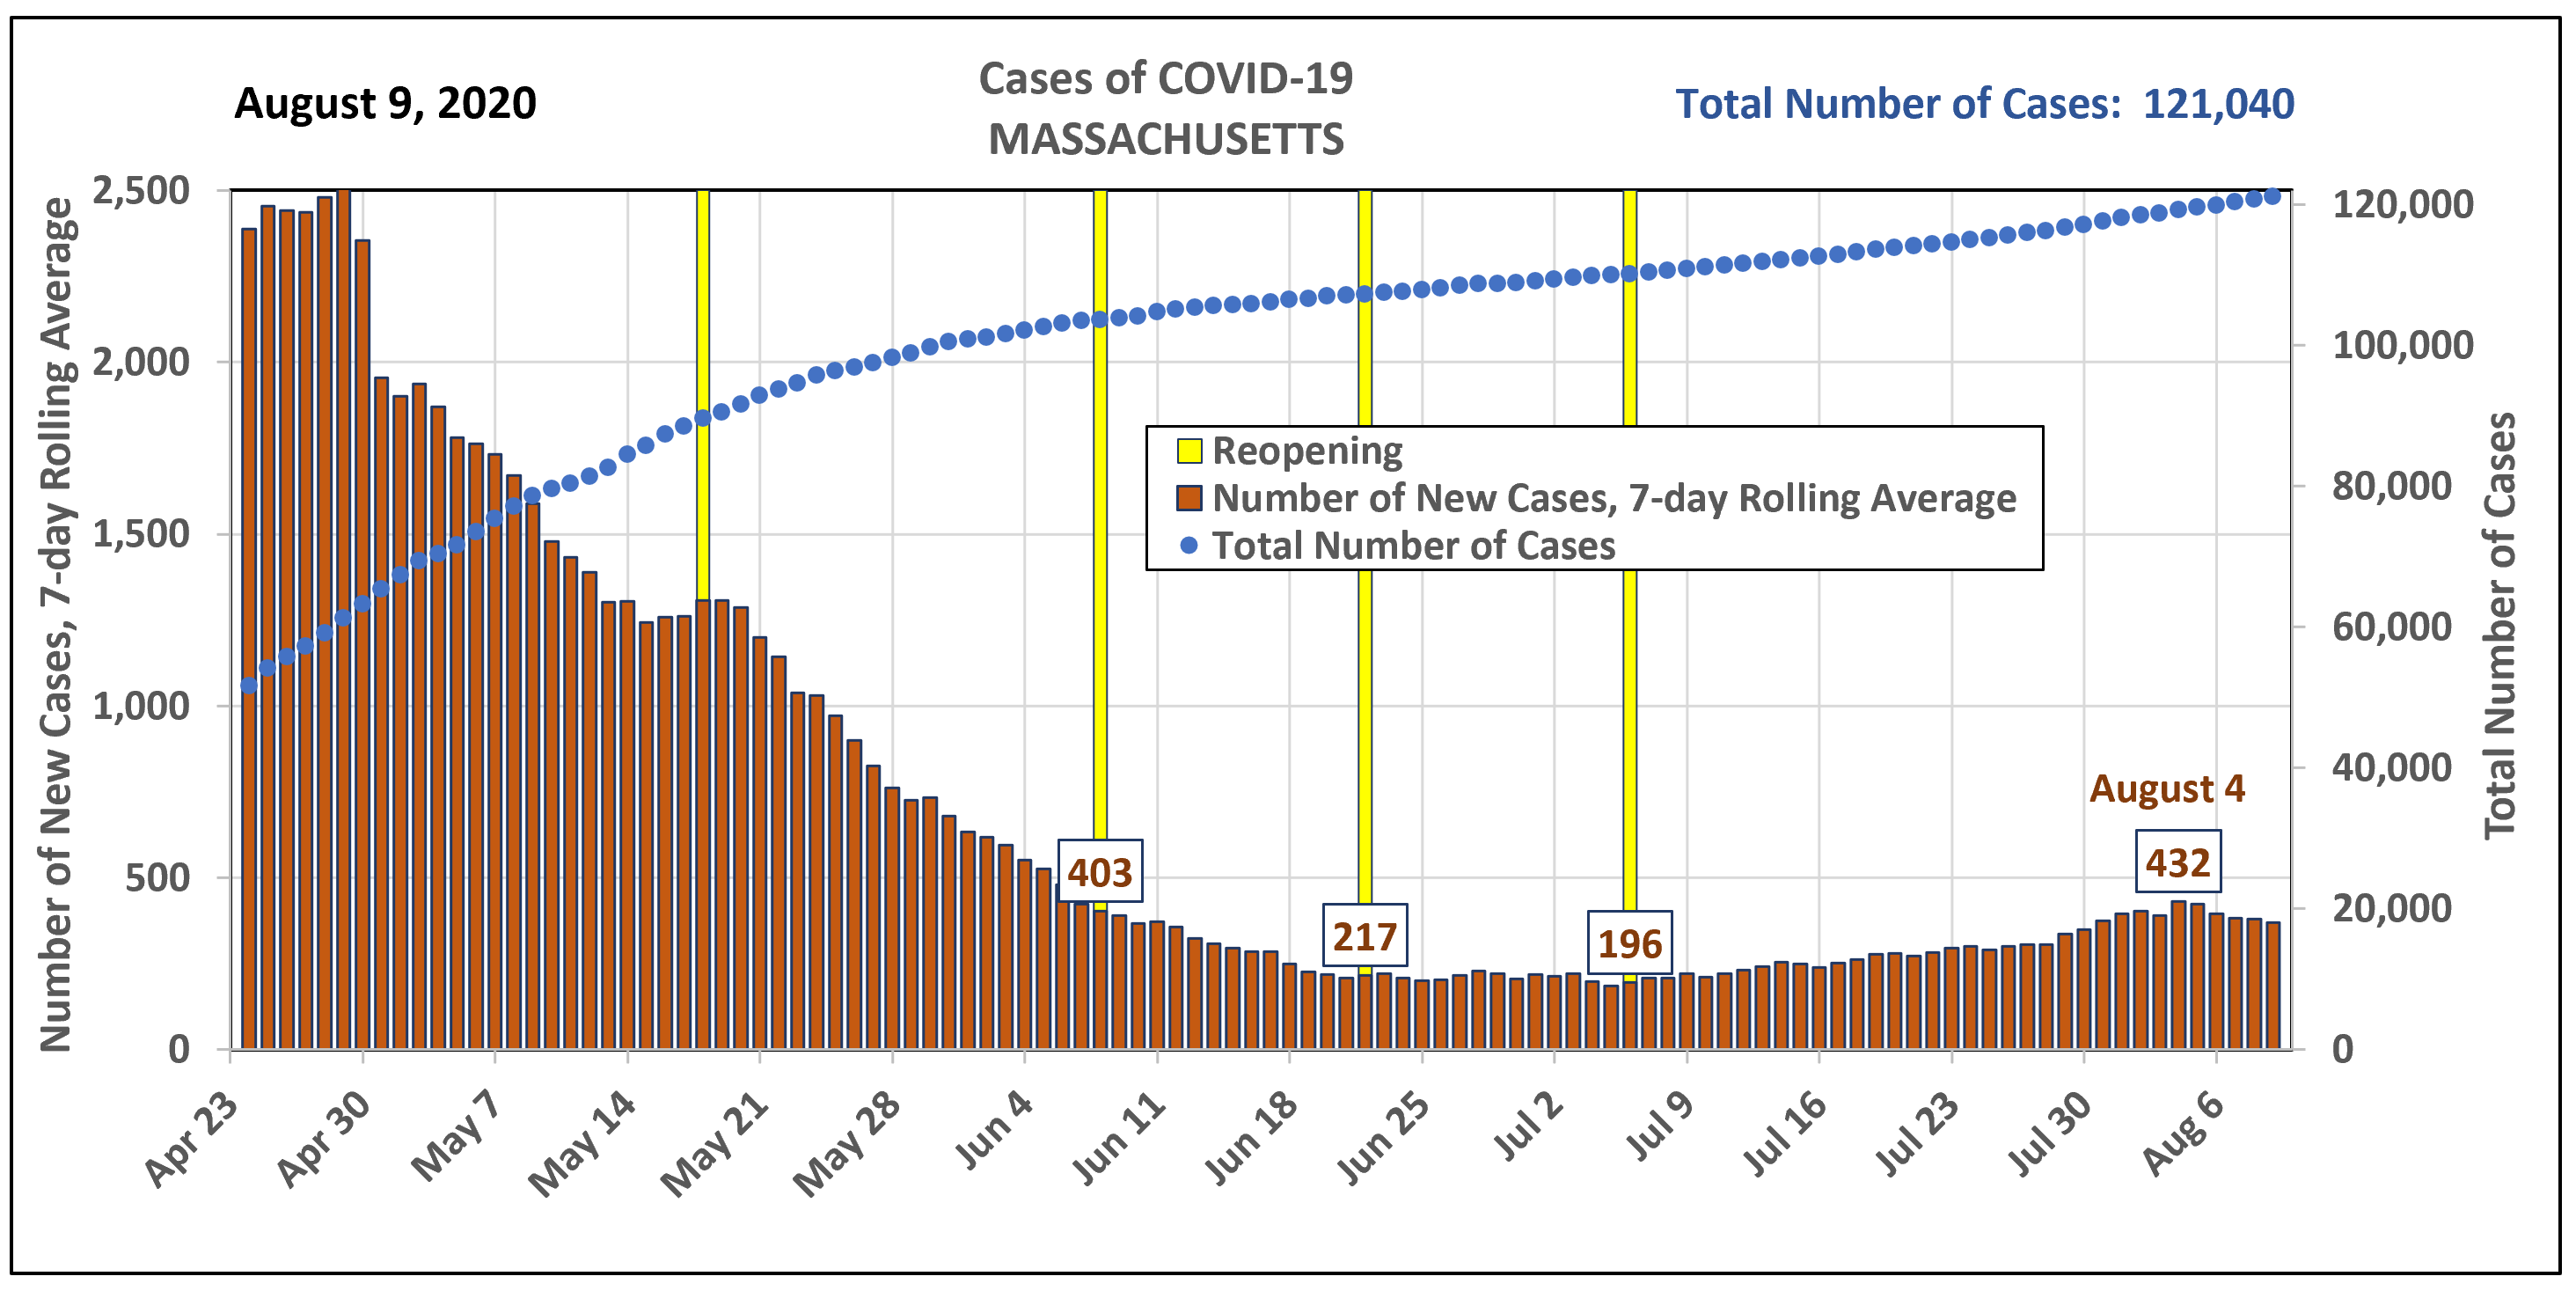
This upward trend in case counts is also seen in the third chart below, which smooths out the trend by plotting the 7-day moving average of new COVID-19 cases derived from County.csv. This troublesome trend over the past month or so is also seen in charts of individual Massachusetts counties at OTHER COUNTIES.